Business growth through data
Find out which of your marketing actually makes you money.
You can see what you spend on ads. It’s much harder to see what that spending brings back. We go through your sales and marketing numbers and tell you, in plain terms, what’s working, what isn’t, and where to put your money next.
01
Start where you are
Every business is at a different stage.
Pick the one that sounds like you.
01
Just getting started?
You're not sure what to track, or you track lots but trust none of it. We set up the numbers you'll need to make good decisions later.
Measure the right things from day one
02
Thinking about a change?
New ad, new price, new signup page? We try it on some of your customers first, so you know if it works before you roll it out.
Test it before you bet on it
03
Spending on several channels?
We work out what Google, Meta, TikTok and your other marketing really bring in, and show you where to move money.
Put your budget where it earns the most
02
Just getting started
Not sure what to track?
Measure the right things from day one
Most new businesses either track nothing, or track everything except what matters. We work out exactly which numbers you need, like where customers drop off, what each one costs to win and what they spend.
Then we help you set it up properly. That gives you a clean starting point, so later you can tell for certain whether a change helped. Getting this right now costs far less than fixing it a year in.
Example
An app is losing people during signup. We map each step, track where people leave and record today’s numbers. Later, when the signup flow changes, you’ll know for sure whether it helped.
Before — one event logged
“Users drop off somewhere in onboarding.”
- App openednot logged
- Account creatednot logged
- Profile stepnot logged
- Permissions stepnot logged
- First actionnot logged
- Signup completelogged
You can see that people leave. You cannot say at which step, on which device, from which acquisition source, or what it costs you.
After — every step captured
“Half of them leave at the permissions screen.”
- App opened1000
- Account created720 −28%
- Profile step610 −15%
- Permissions step305 −50%
- First action260 −15%
- Signup complete240 −8%
A baseline: the real drop rate at every step, segmentable, with enough clean volume to detect a change later.
Made-up numbers, for illustration only.
What you get
- A short plan listing what to track and why.
- Help setting it up with your developer or shop platform.
- Your starting numbers to compare against later.
03
Thinking about a change
Will this change actually work?
Test it before you bet on it
Instead of changing everything and hoping, we try the change on some of your customers and compare them with the rest. You find out what works before you spend big on it.
Example · online
Half your visitors see the new checkout page, half see the old one. We compare sales and tell you whether the difference is real or just luck.
Example · several locations
We pause ads in a few towns and compare them with towns where ads kept running. That shows what your ads really add.
What you get
- A test plan before you start: how long it runs and how many customers it needs.
- A clear answer at the end: it works, it doesn't, or it's too early to tell.
- A one-page summary.
04
Spending on several channels
Which channels are actually paying for themselves?
Put your budget where it earns the most
Google, Meta and TikTok each report their own results, and they all take credit for the same sales. We use your own sales history to work out what each channel really brings in.
Then we show you how to move money between them to get more sales from the same budget. Where possible, we check the results with a real-world test, so you’re not relying on a model alone.
Good fit if: you’ve been spending on ads across a few channels for at least a year.
What you get
- What each channel really brings in.
- The point where spending more stops paying off.
- A recommended budget split.
(The industry term for this is marketing mix modeling.)
See a sample05
The reporting problem
Five dashboards, five different answers
Add up what every ad platform says it sold, and you’ll often get more sales than you actually made.
1 — What you spend
2 — What each dashboard claims it caused
3 — What actually happened
Revenue on your books
$8.40M
Of which media actually caused
$6.52M
The rest is baseline demand, seasonality and price — it would have arrived with no ads at all.
The platforms claim 1.3x your booked revenue, because the same order is sold back to you by every channel that touched it.
4 — What we do with it: move the money, not add to it
Channels on the flat part of their response curve are saturated — the next dollar there buys almost nothing. Channels still on the rise have headroom. Total spend is unchanged: $2.40M before, $2.40M after.
Blended ROAS on the same budget
2.87x3.43x
+19.5% revenue from the same $2.40M of media — then verified with a geo-holdout before you commit the budget.
Simulated dataset — illustrative, not client data
Made-up example
What this looks like in practice
900
sales the ad platforms claimed
600
sales the shop actually made
A webshop spends 60,000 kr a month on Meta, Google and TikTok. Added together, the three platforms claim 900 sales, but the shop actually made 600. When we looked at the shop’s own sales, most of TikTok’s “sales” would have happened anyway. Moving part of that budget to Google brought more sales for the same total spend.
Illustrative numbers, not client data.
The same picture, channel by channel
Switch between what the platforms say and what each channel really brought in.
| Source | Spend | Revenue credited | ROAS | Share of the $8.4M booked |
|---|---|---|---|---|
| Meta Ads Manager | $0.96M | $4.03M | 4.20x | |
| Google Ads | $0.72M | $4.32M | 6.00x | |
| TikTok Ads | $0.36M | $1.08M | 3.00x | |
| Klaviyo / email | $0.12M | $0.90M | 7.50x | |
| Affiliate & other | $0.24M | $0.56M | 2.33x | |
| Sum of the dashboards | $2.40M | $10.89M | 4.54x | |
| Revenue on the books | $8.40M |
The platforms credit themselves with $10.89M against $8.40M of actual revenue — including revenue that would have arrived with no ads at all. Every ROAS in that column is a different number for the same customer, counted more than once.
Simulated dataset — illustrative, not client data
06
At the end
What you get at the end
A decision deck: what we found and what to do next, in plain language, written for whoever makes the decisions.
A technical report: all the working, model checks and budget optimisation, for anyone who wants to check it.
The two pages below are excerpts from the technical report, not the decision deck. They show the budget allocation optimisation from a Robyn marketing mix model.
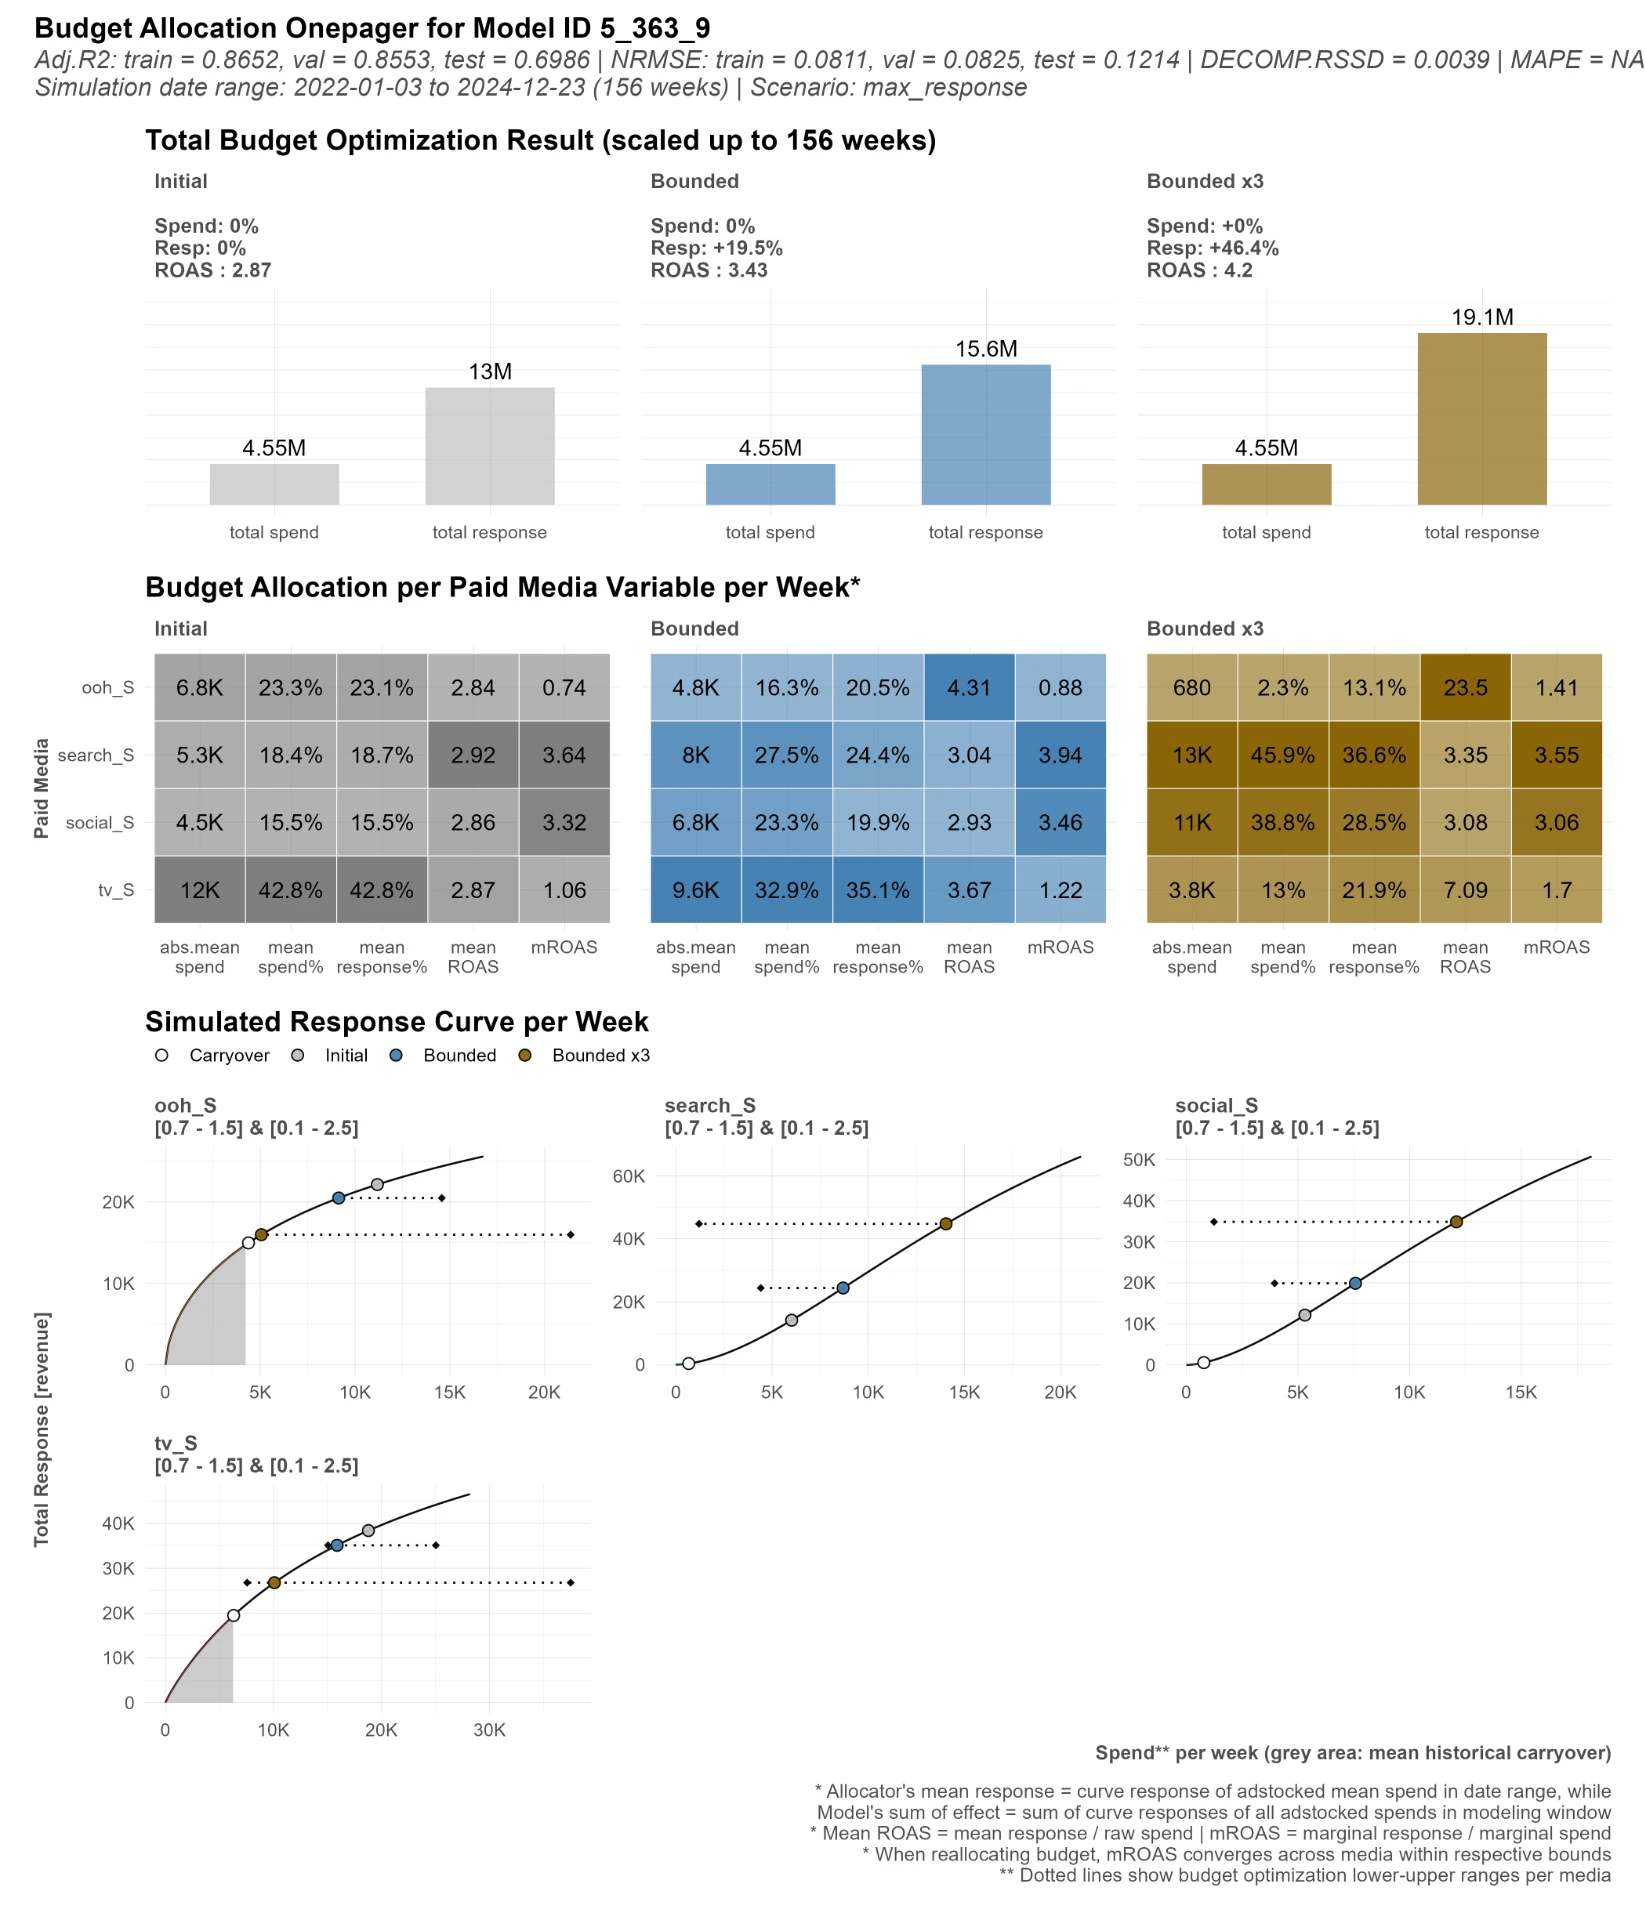
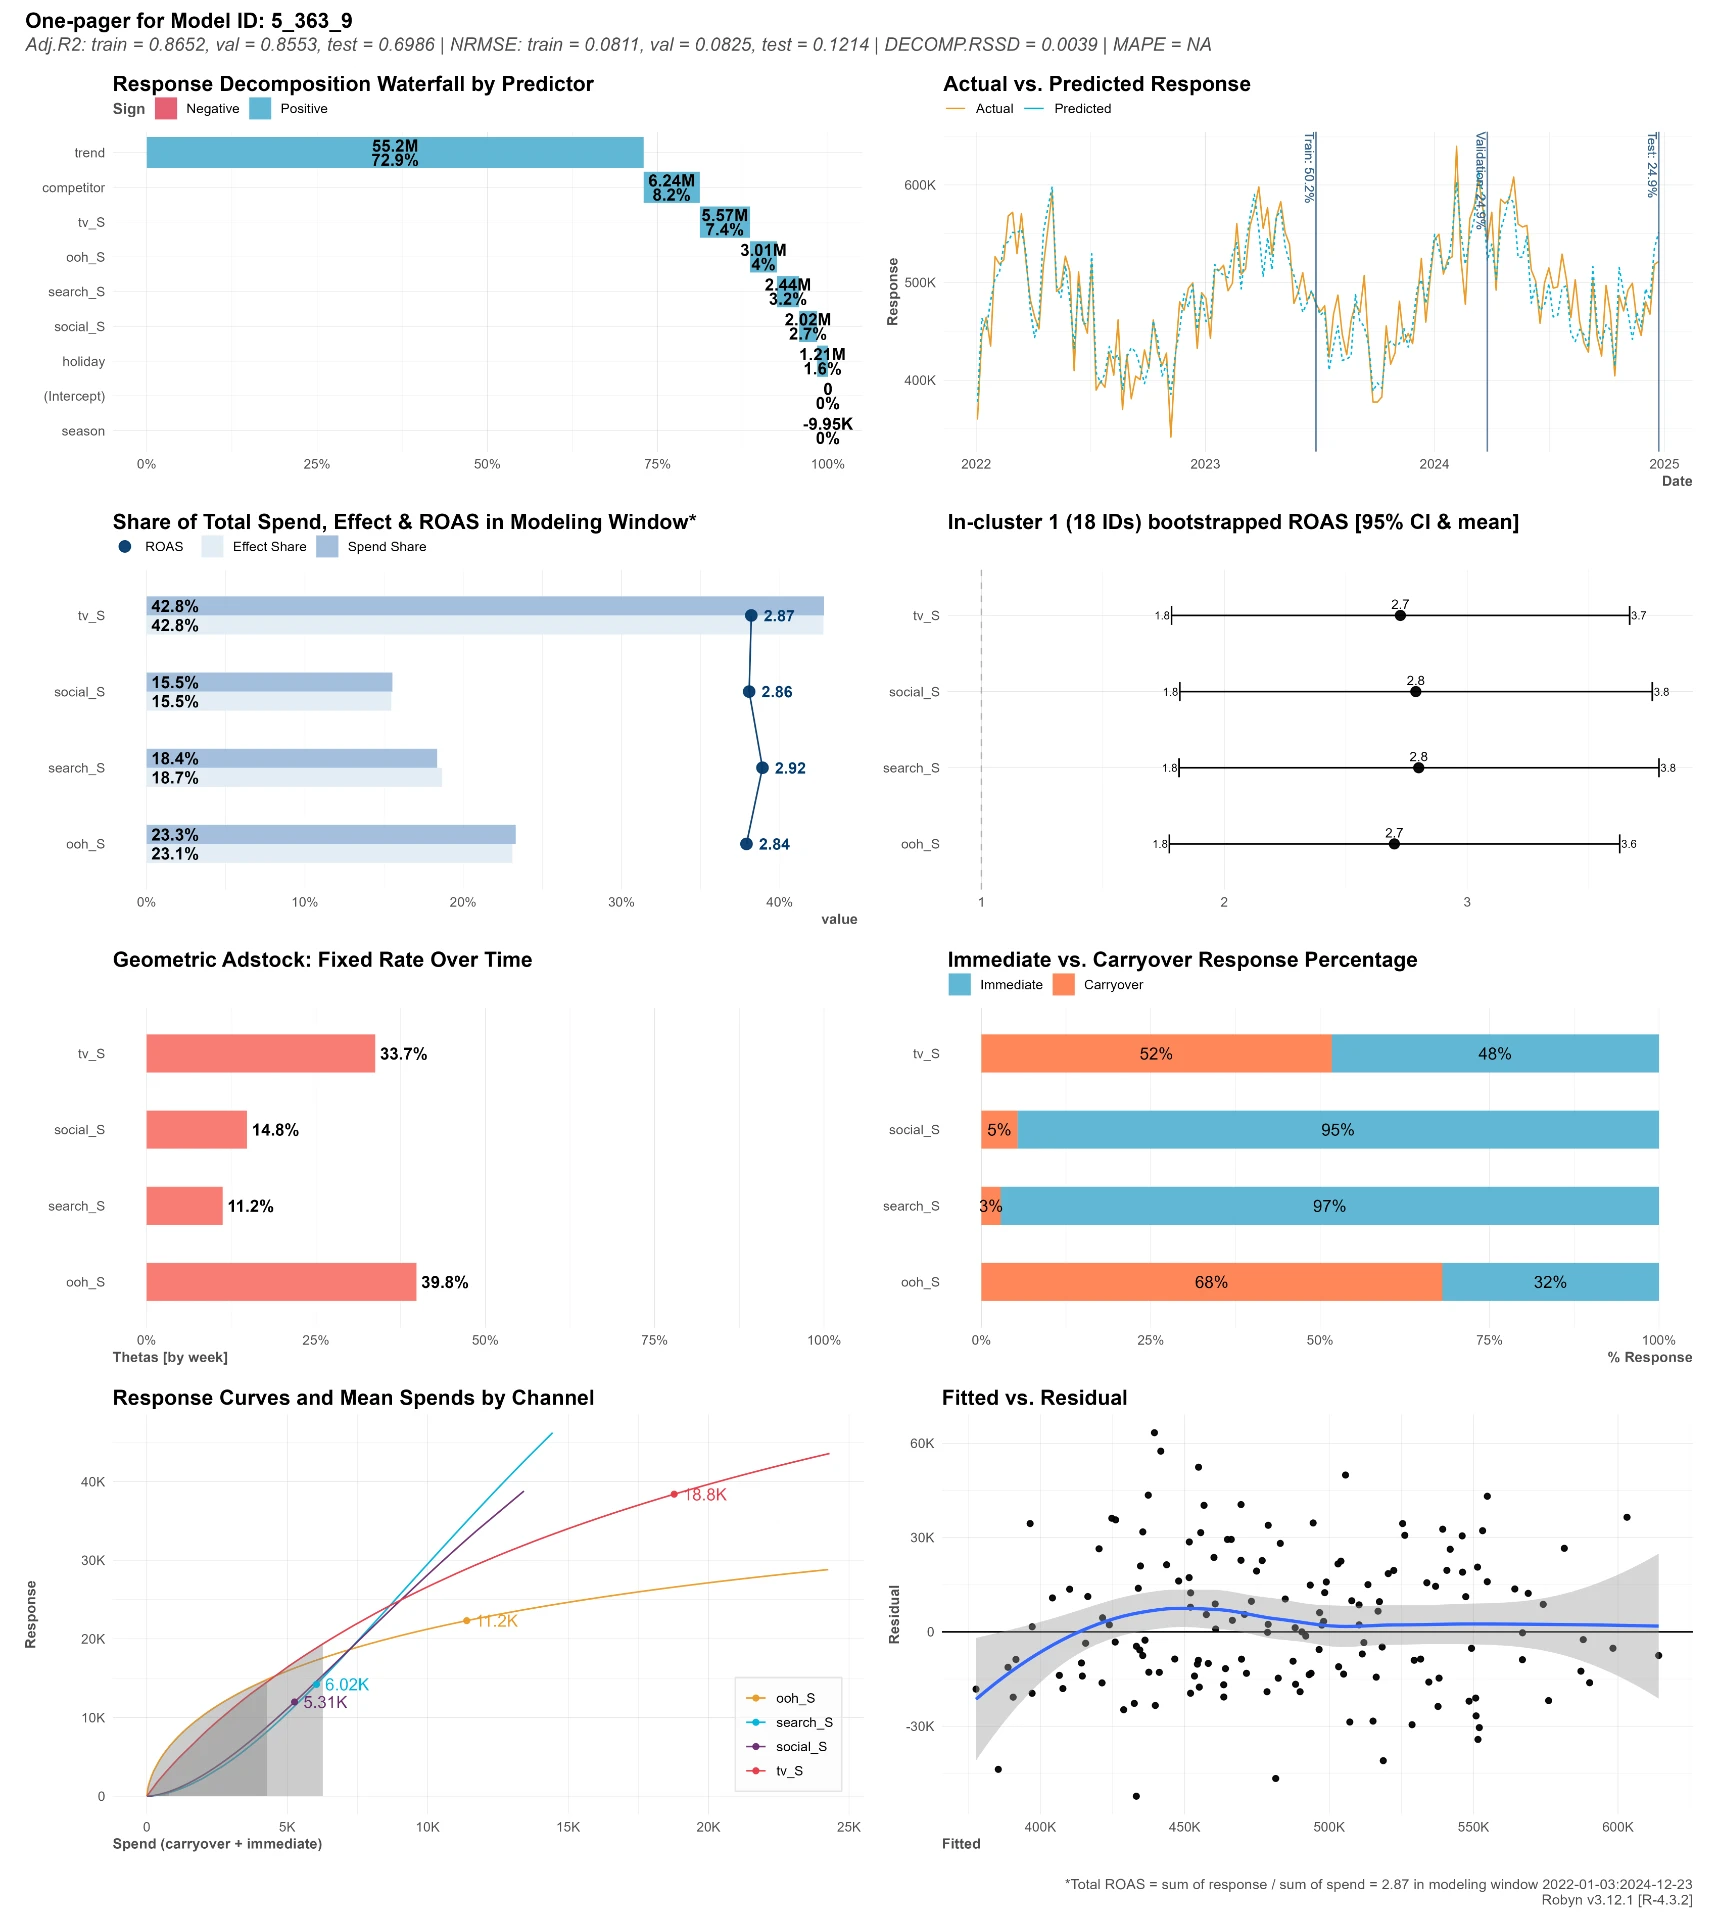
Uses made-up data. Written for analysts; most clients only need the decision deck.
07
Sample work
What a finished project looks like
Each project comes with a short summary for the decision-maker and a full report for anyone who wants to check it. These samples use made-up numbers, not client data.
Measuring the right things

Don't know what data to collect? Start here.
The founder-facing case for instrumenting before you spend a dollar.
Sample coming soon
Data Collection & Measurement Plan
Event taxonomy, metrics tree, baseline plan and method roadmap, worked through an app onboarding funnel.
Sample coming soonTesting changes before rolling them out

Stop guessing. Prove what moves the number.
Three tests — landing-page message, free-shipping threshold, onboarding — in plain, bottom-line language.
Sample coming soon
A/B & A/B/n Testing Programme
Three fully designed and powered experiments across marketing, offer/attribution and growth.
Sample coming soonWhat your ads really add, town by town

Does the ad spend actually cause the sales?
Pausing ads in some towns to see what they really add.
Sample coming soon
Geo-Holdout & Synthetic Control
The full working behind a town-by-town ad test.
Sample coming soonWhere to move your budget

Move budget. Grow revenue without spending more.
Same budget, better split — written for the decision-maker.
Sample coming soon
Ad Spend & Margin Review
Full budget-reallocation analysis with model diagnostics and a complete maths appendix.
Sample coming soon08
How it works
How it works
01
Free 20-minute call.
Tell us about your business and what you want to know. No preparation needed.
02
A fixed-price quote.
Within two working days you get a written quote: what we'll do, what you'll get, the timeline and one fixed price.
03
You decide.
No obligation and no monthly retainer. If you go ahead, we start.
Most projects start from $750.
Get a quote09
In the pipeline
Not ready yet. Ask if you want to be first.
These aren’t available yet. We list them because clients ask about them.
Coming later
Budget advice for shops and restaurants with many locations
For chains rather than online stores. We look at all your locations together, so even small branches get a reliable answer about what their marketing brings in.
Coming later
How much is a customer worth, and who is about to leave?
For businesses where customers buy again or subscribe. We estimate what each customer will spend in the future, and spot the ones who have quietly stopped coming back.
10
Questions
Common questions
11
About · Book a call
Not sure where to start?
Book a free 20-minute call. Tell us what you’re spending and what you’re unsure about, and we’ll tell you honestly whether we can help.
- Reply within two working days
- One fixed price, in writing, before anything starts
- No monthly retainer
- NDA on request
- We never promise results we can't back up

Jan Ljungar — Statistician
I’m a statistician (BSc in Statistics, MSc in progress). I help business owners figure out which of their marketing is actually working, using the same methods large companies use, at a scale that makes sense for smaller ones. You work with me directly, from the first call to the final report.